Infographics are a great way for students to visually represent information they are learning about. There are a variety of infographic tools out there, including Canva, Piktochart, Infogram, and Easelly.
In this post, I wanted to focus on Canva. I’ve selected this tool because I find it the easiest to get started with (they even have a dedicated Infographics Maker page) and Canva offers the greatest variety of templates to use as a base for your project. I typically think of Canva as more of a “graphic design” tool than geared to infographic creation. It’s great for creating posters, cover images, and resumes – and this might be what most people think to use Canva for. But, Canva also provides Charts and other Icons perfect for creating infographics.

Below, I want to share some tutorials that you can use personally or with your students to get started. In addition to the infographic resources, Canva provides a variety of design tips that you can share with students to help them create more visually impactful presentations.
Library of Tutorials: https://designschool.canva.com/tutorials/
Infographic maker: https://www.canva.com/tools/infographic-maker/
Infographics Tutorials:
- Introduction to infographics: https://www.canva.com/design/DAClEYI3n-c/TOnr2Yzl8OEgmQ3SC8LZjw/edit
- Starting with Scale: https://www.canva.com/design/DAClEe4kCrw/u8qJBqBfChfGUI5RSNDZUA/edit
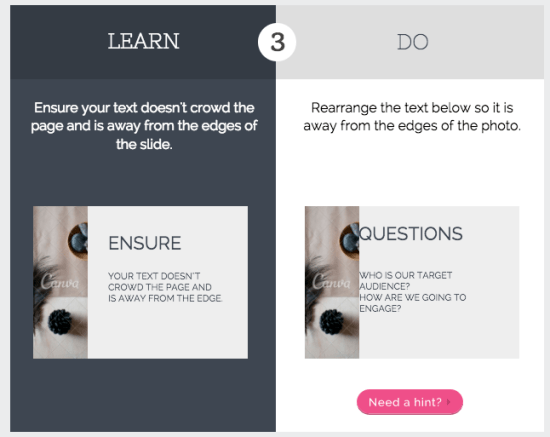
Designing a Presentation Tutorials:
- Create well-designed, professional presentation: https://www.canva.com/design/DAClEXd-lb4/fxSgbYV_CIOyM3HyyGk0vw/edit
- Design tips for creating professional presentations, with clean & clear graphics: https://www.canva.com/design/DAClEcgUKUw/cYhWYCMOg8H4CS_r2VfVTA/edit
Note: If you are looking for a tool with a stronger chart builder and more options for creating data-based graphics, I recommend looking into Piktochart. Canva has many of the same features, and I find it a bit more user-friendly, but Piktochart is specifically marketed as an infographic maker and so it does offer some more options.
